DevTools
A browser-based inspector for debugging Stream Deck plugins built with streamdeck-react.
Opening the DevTools
The devtools are a browser-based inspector that connects to your running plugin over HTTP + SSE (Server-Sent Events). You can use either the hosted version or run a local copy.
Hosted Version
Open the devtools directly in your browser -- no installation required:
streamdeckreact.fcannizzaro.com/devtools
Just visit the URL while your plugin is running in development mode. The UI will automatically discover any active plugins on localhost.
Local Version
You can also run the devtools locally using the @fcannizzaro/streamdeck-react-devtools package:
bunx @fcannizzaro/streamdeck-react-devtoolsOr install it as a dev dependency in your project:
bun add -D @fcannizzaro/streamdeck-react-devtoolsThen run it:
npx streamdeck-react-devtoolsThe local server starts on 127.0.0.1, serves the devtools UI, and automatically opens your browser.
Enabling DevTools in Your Plugin
Enable the devtools server by setting devtools: true in your createPlugin configuration:
import { createPlugin } from "@fcannizzaro/streamdeck-react";

const plugin = createPlugin({
  devtools: true,
  fonts: [
    // ...your fonts
  ],
  actions: [
    // ...your actions
  ],
});
The port is derived deterministically from the plugin UUID (range 39400 -- 39499), so the same plugin always uses the same port.
How It Works
- When
devtools: trueis set, the plugin starts an HTTP server onlocalhost(port range 39400 -- 39499). The port is derived from the plugin UUID hash. - The browser UI auto-discovers running plugins by scanning that port range.
- Once connected, the devtools receive real-time updates: renders, console output, network requests, events, and the component tree.
- All devtools code is automatically stripped from production builds -- there is zero overhead in release bundles.
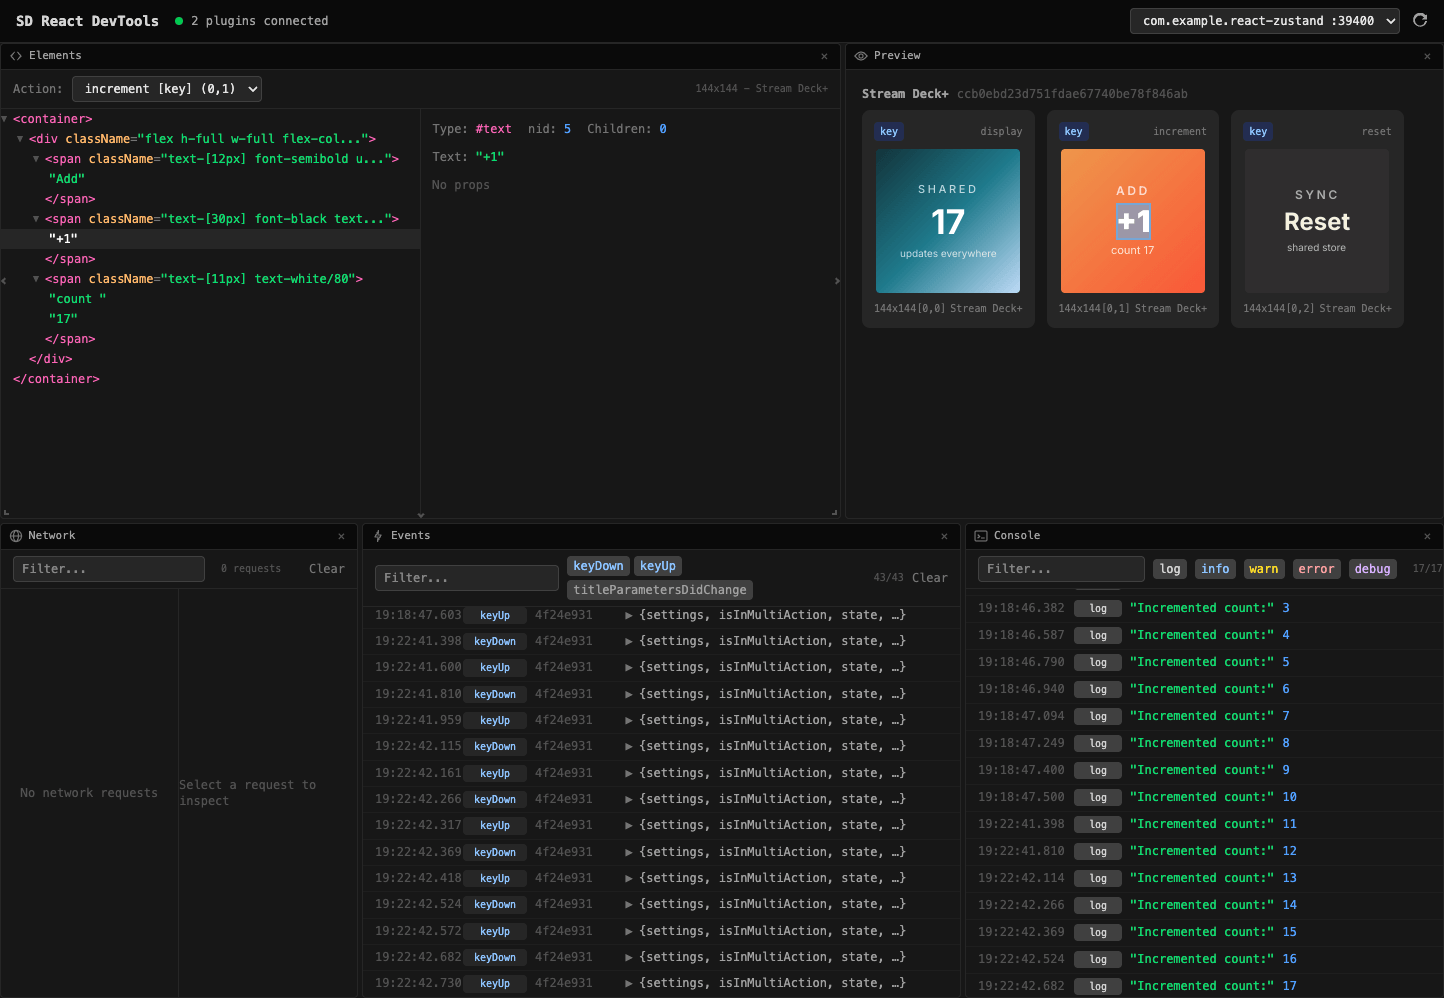
Panels
The devtools UI provides six panels for inspecting different aspects of your plugin:
| Panel | Description |
|---|---|
| Console | Intercepted console.log, console.warn, console.error, console.info, and console.debug output from your plugin. |
| Network | Intercepted fetch requests and responses, including method, URL, status, headers, and body. |
| Elements | A tree view of the VNode component hierarchy for each action. Hover over a node to highlight it on the physical Stream Deck device. |
| Preview | Live rendered images for every active action and touch bar surface. |
| Events | EventBus emissions such as keyDown, keyUp, dialRotate, touchTap, and more. |
| Performance | Render pipeline metrics: flush counts, skip rates per phase, cache hit ratios, average and peak render times, and memory usage. |
The Performance panel displays data from the render metrics collector -- cumulative counters for each phase of the 4-phase skip hierarchy, plus cache statistics and timing breakdowns. Render updates are throttled to a maximum of 10 renders per second per action over the SSE stream (100ms leading + trailing) to avoid overwhelming the browser.
Features
- Element highlighting -- hover over a node in the Elements tree and the corresponding area is highlighted with a cyan overlay directly on the Stream Deck hardware.
- Multi-plugin support -- if multiple plugins are running with devtools enabled, the UI discovers all of them and lets you switch between them.
- History and filters -- console, network, and event panels keep a scrollable history with text search and level filters.
- Automatic production stripping -- the devtools server and all instrumentation hooks are removed from the bundle when building for production (
NODE_ENV=production).